Skip to content

CRYPOBIT — Crypto Trading Platform, Live Pricing & Staking

{ CASE STUDY DETAILS }

The problem, the decisions we made, and what actually changed for the client after launch

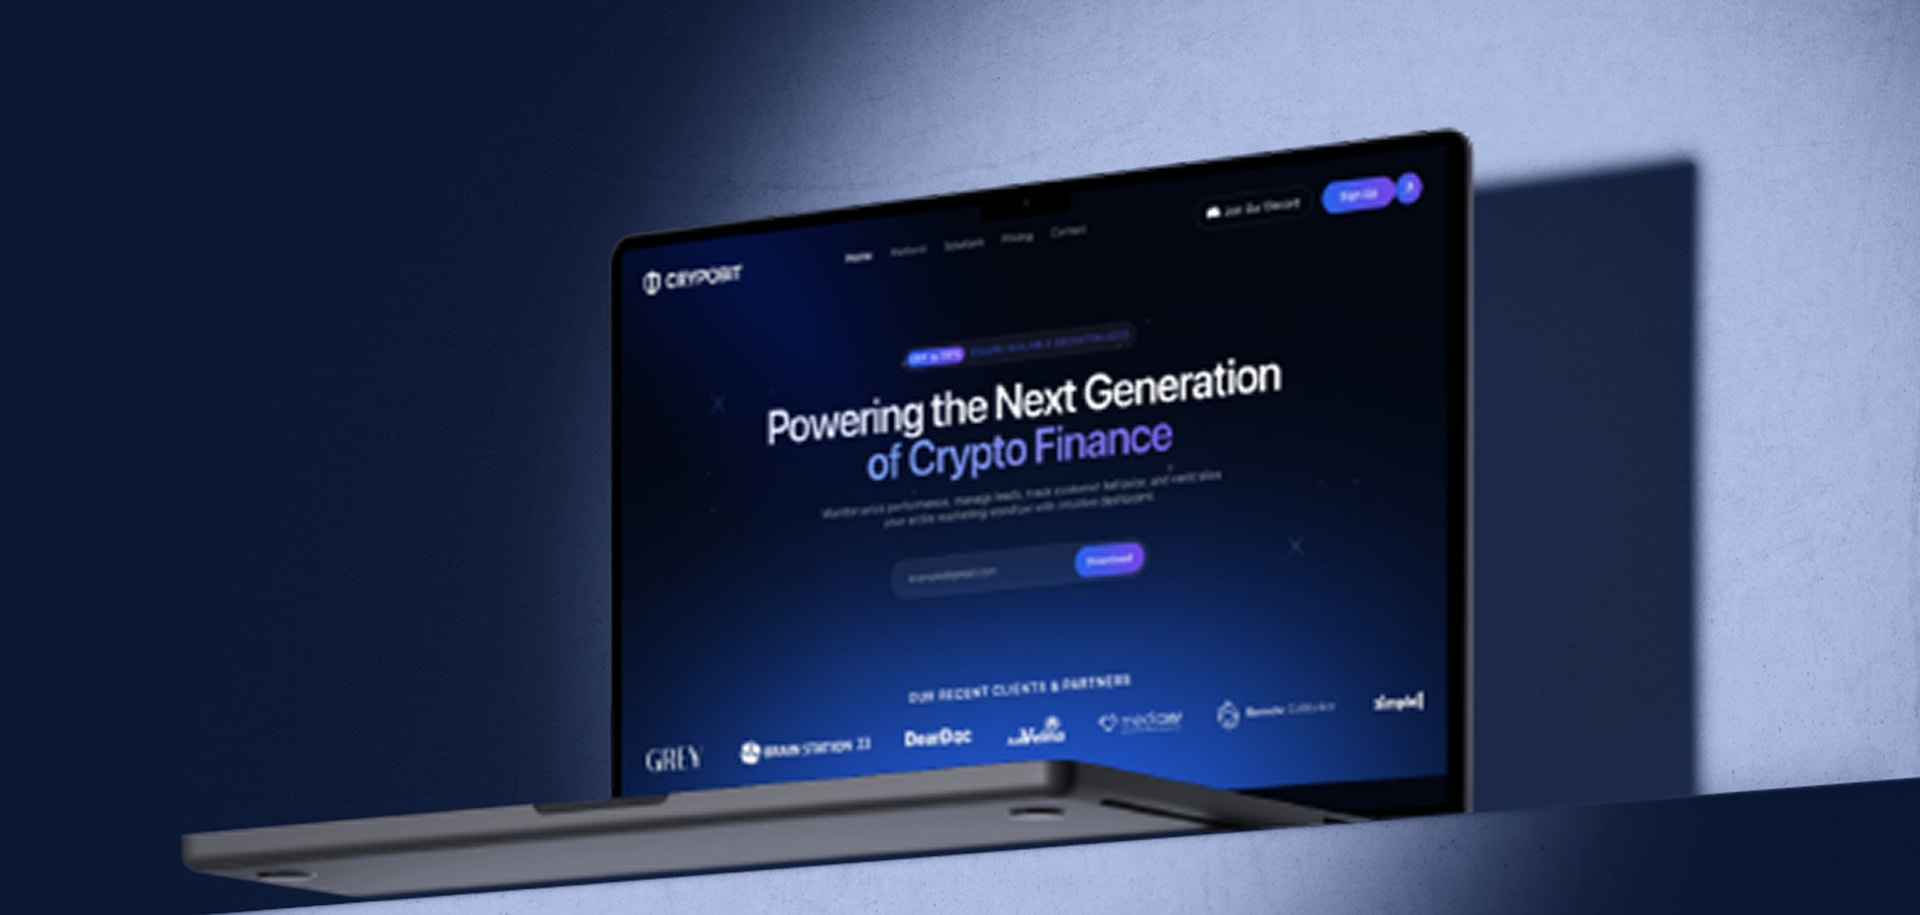
The CRYPOBIT trading homepage open on a laptop against a blue wall

PROJECT NAME:

CRYPOBIT — Crypto Trading Platform

INDUSTRY:

Crypto & Fintech

ENGAGEMENT:

Platform build + launch

DESIGN:

Sabariya Muzumder

TOOLS USED:

Next.js, Node.js, PostgreSQL, Redis, WebSocket

LOCATION:

Dhaka, Bangladesh

A Trading Platform Has To Sell Before It Can Be Trusted

A crypto product carries two jobs that pull against each other. It has to convince a first-time visitor it is worth signing up for, and it has to show enough working instrumentation — live prices, portfolio movement, staking yield — that an experienced trader believes there is a real platform behind the pitch. We built CRYPOBIT as one page that does both: it moves from the marketing hero into live dashboard surfaces without a reload, and the numbers on the public half are the same numbers the signed-in half runs on.

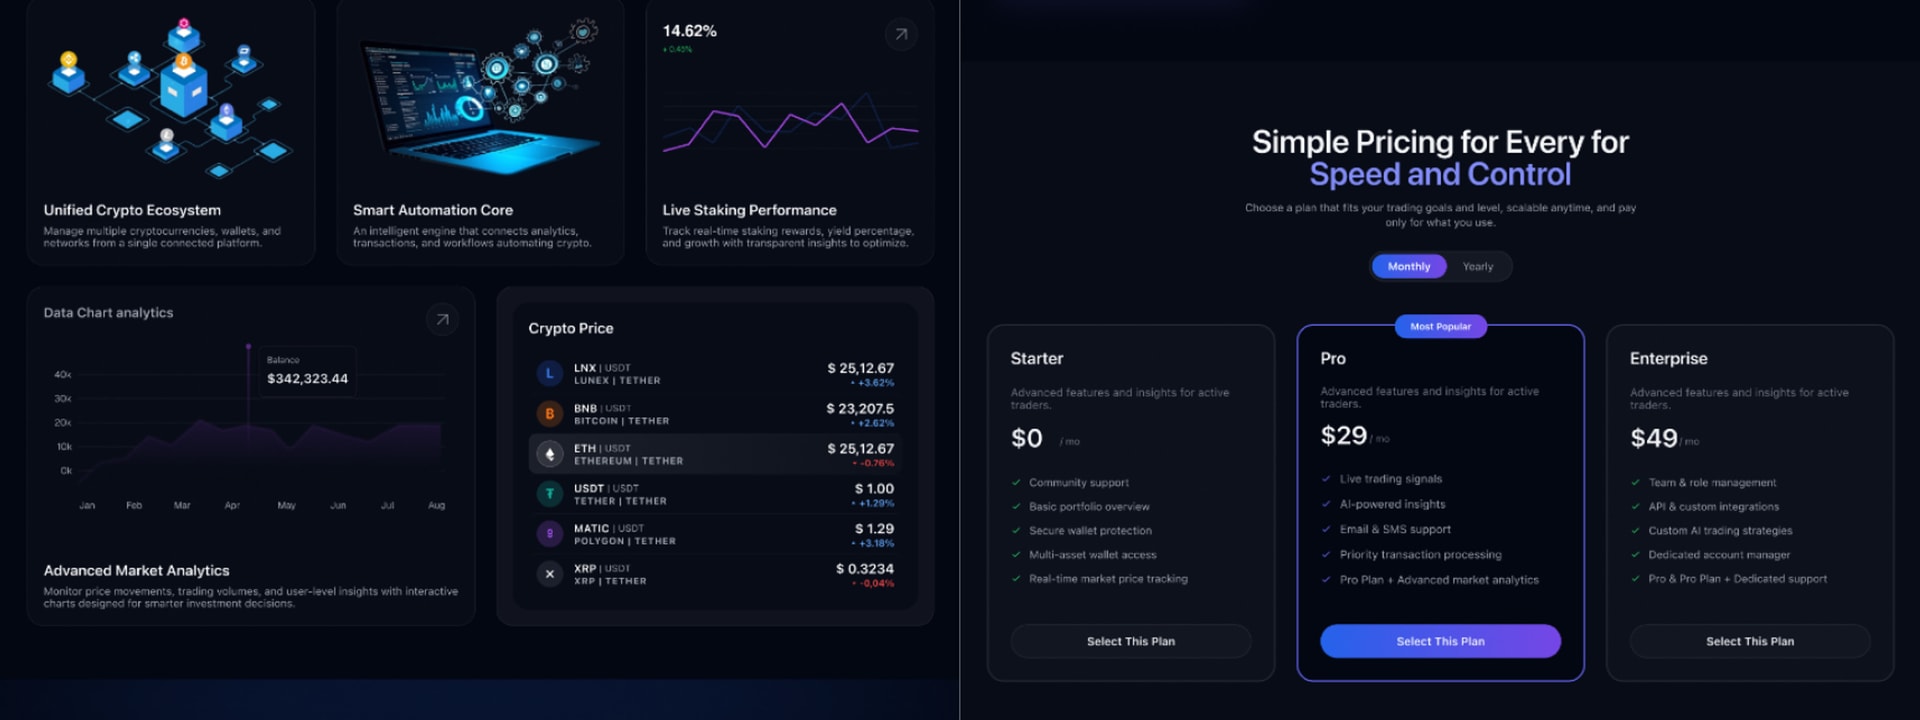
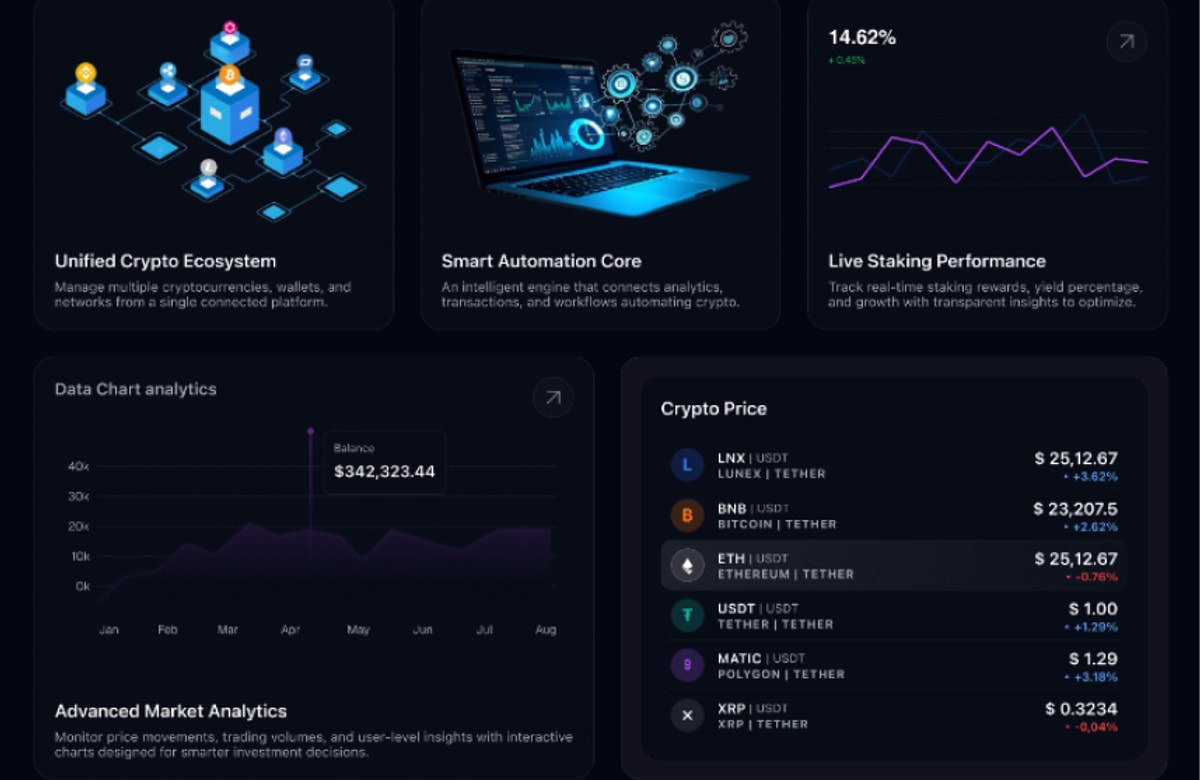
CRYPOBIT platform feature cards and market analytics beside the three-tier pricing table

Problem:

Credibility Is The Hard Part, Not Decoration

Crypto products fail in one of two directions. Either the public page is all marketing — gradients, promises and no evidence the thing does anything — or it is a wall of instrumentation that means nothing to someone deciding whether to sign up. We had to put both on a single page without the join showing, in a category where visitors arrive already sceptical, and we had to do it without the live half costing more to serve than it was worth.

Key issues identified:

  1. Two Audiences, One Page: A first-time visitor and an active trader need different proof, and both land on the same screen.
  2. Live Data In Front Of Anonymous Traffic: Real-time prices are the proof, and they are also an open connection for every visitor who scrolls that far — including the ones who will never sign up.
  3. Plan Choice Without A Wall Of Comparison: Three tiers had to separate at a glance, and the billing behind them had to survive upgrades taken halfway through a month.
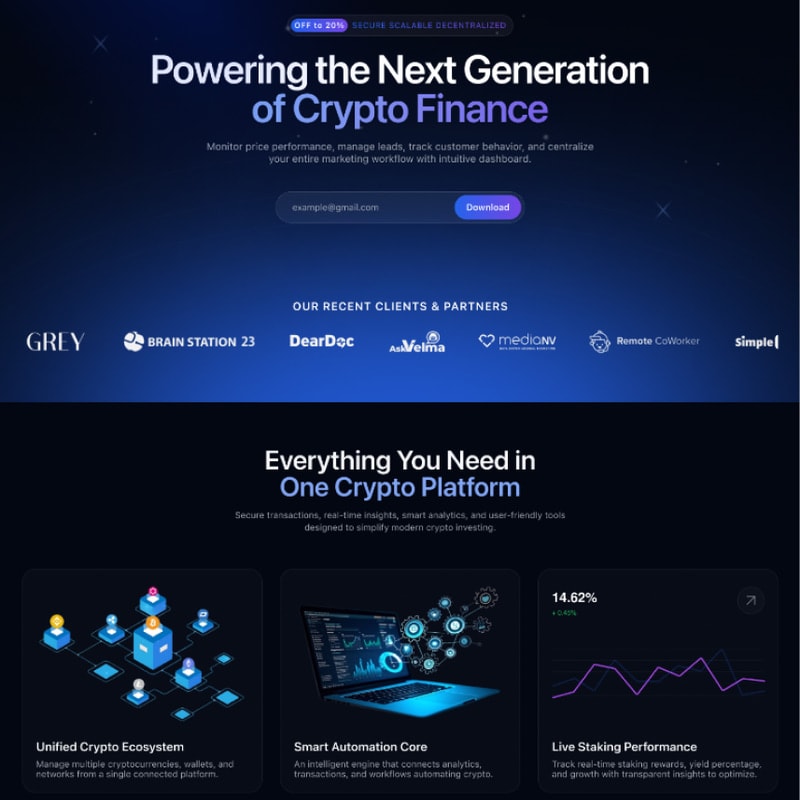
CRYPOBIT hero headline, email capture and client logo strip above three platform feature cards
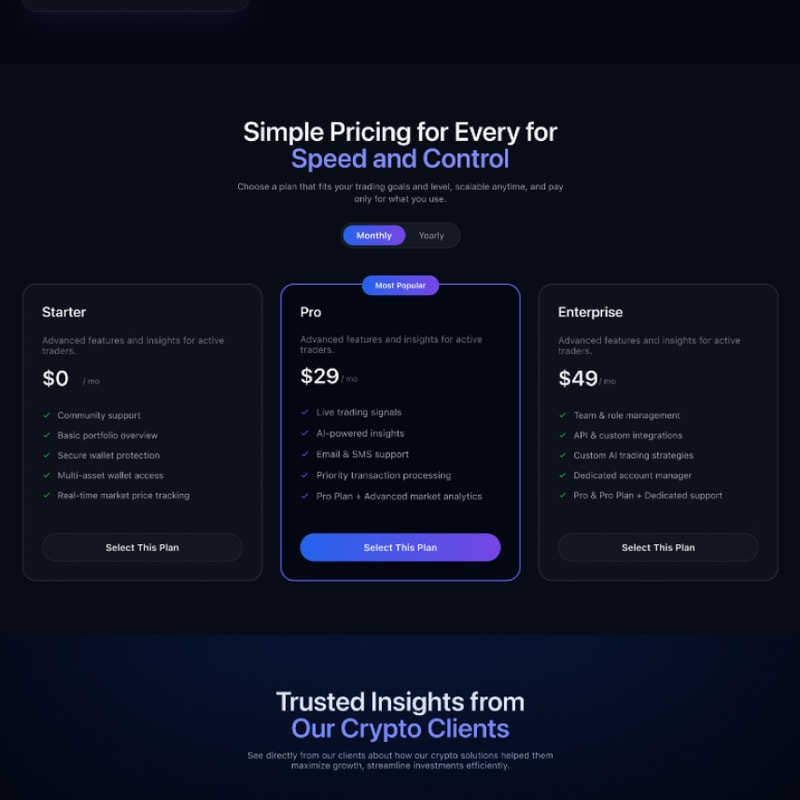
CRYPOBIT pricing table with Starter, Pro and Enterprise plans on a dark background
The CRYPOBIT trading interface open on a laptop resting on a lit shelf

Solution:

Marketing Surfaces Wired To The Live Product

The page opens on a blue gradient hero and then drops into near-black for everything after it, so the shift from pitch to product is carried by the background rather than by a section break. Each feature claim is paired with the instrument that backs it — the ecosystem card with its network diagram, automation with a connected dashboard, staking with a live performance line — and those instruments read from the same API the signed-in product uses, so nothing on the public page is a screenshot of something that happens elsewhere.

Price ticks arrive on one upstream subscription, land in Redis and fan out to every connected browser from there, which is what makes live data on an anonymous page affordable: one feed, not one per visitor. The pair panel and the portfolio chart both read off it, and balance history is rolled up in PostgreSQL overnight so an eight-month chart is one query rather than a scan. Pricing resolves into three tiers — free, twenty-nine and forty-nine dollars — with the middle plan outlined and badged, and upgrades prorated against what is left of the current month.

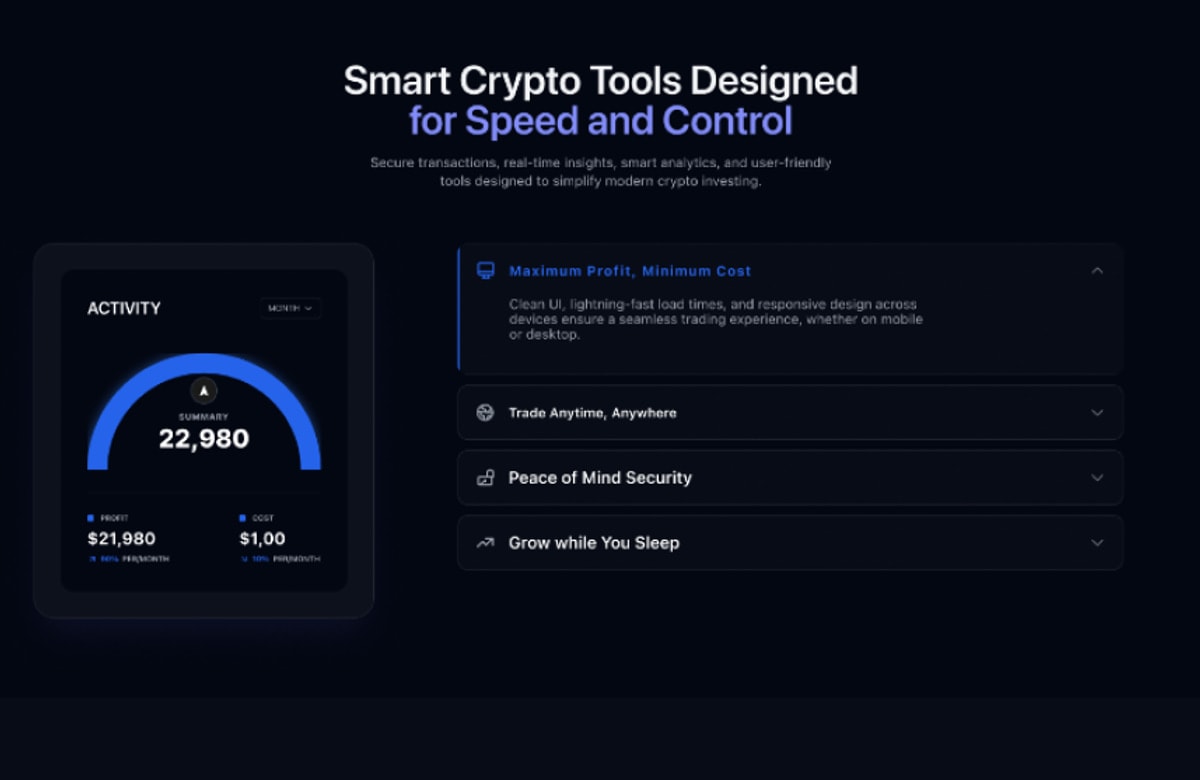
Monthly activity gauge beside expandable panels for cost, availability, security and yield
Portfolio balance chart beside a live crypto price list showing six pairs against Tether

Key Takeaways:

Show The Instrument, Not A Picture Of One

The sections that earn their place here are the ones wired to the running system rather than illustrating it. A price list with real pairs and real percentage moves does more for trust than a paragraph claiming the platform is fast, and it takes the same space on the page. The engineering question was never whether to show live data on a marketing surface — it was how to serve it to traffic that has not signed up for anything, which turns out to be a caching problem rather than a design one.

What this project reinforced:

  1. Let Contrast Carry The Structure: Moving from a blue hero into near-black separates pitch from product without a visible seam.
  2. Pair Every Claim With Its Instrument: A feature card beside the live chart that proves it beats the same card beside an icon.
  3. Fan Out, Do Not Multiply: One upstream price subscription served to everyone through Redis is what makes a live public page cheap to run.

Outcomes & Impact:

Sign-Up Conversion

+38%

Visitors who reached the pricing table after the live price panel signed up more often than those shown the pitch alone.

Pro Tier Share

61%

Of new subscriptions took the middle plan, which is outlined and badged rather than argued for at greater length.

Session Length

9m

Median time on the page, most of it spent on the portfolio chart and the live pair list rather than on the hero.

Return Visits

2.4x

Traders came back to the dashboard surfaces more often than to any marketing section above them.

© Client Feedback

//028 Delivered

Why teams keepbuilding with us

We do not just finish projects — we stay on after launch. Here is what the teams we shipped for have to say.

Two colleagues collaborating over a laptop

[ FAQ ]

Questions We GetAsked Most

Timelines, pricing, ownership and what happens after launch — laid out plainly before we begin.

QUESTION [6+]

Still have questions?

Ask us anything

// A focused MVP usually ships in 8–12 weeks. Larger SaaS platforms and multi-tenant systems run 4–6 months, delivered in two-week increments so you see working software throughout rather than at the end.